
CloudWatch RUM on AWS: Real Observability Beyond the Visitor Counter
How I replaced the CRC visitor counter with CloudWatch RUM: real browser telemetry, the Cognito credential flow, and two gotchas the docs don't mention.
April 5, 2026
If you're doing the CRC and you want to go beyond the spec, skip the vanity metric and set up CloudWatch RUM instead.
The Cloud Resume Challenge spec calls for a visitor counter. A JavaScript fetch to a Lambda-backed API, increments a DynamoDB value, displays the number on the page. I built it. It works.
It's also completely useless.
If you're doing the CRC and you want to go beyond the spec, skip the vanity metric and set up CloudWatch RUM instead. Here's exactly how I did it, what broke, and what I'd do differently.
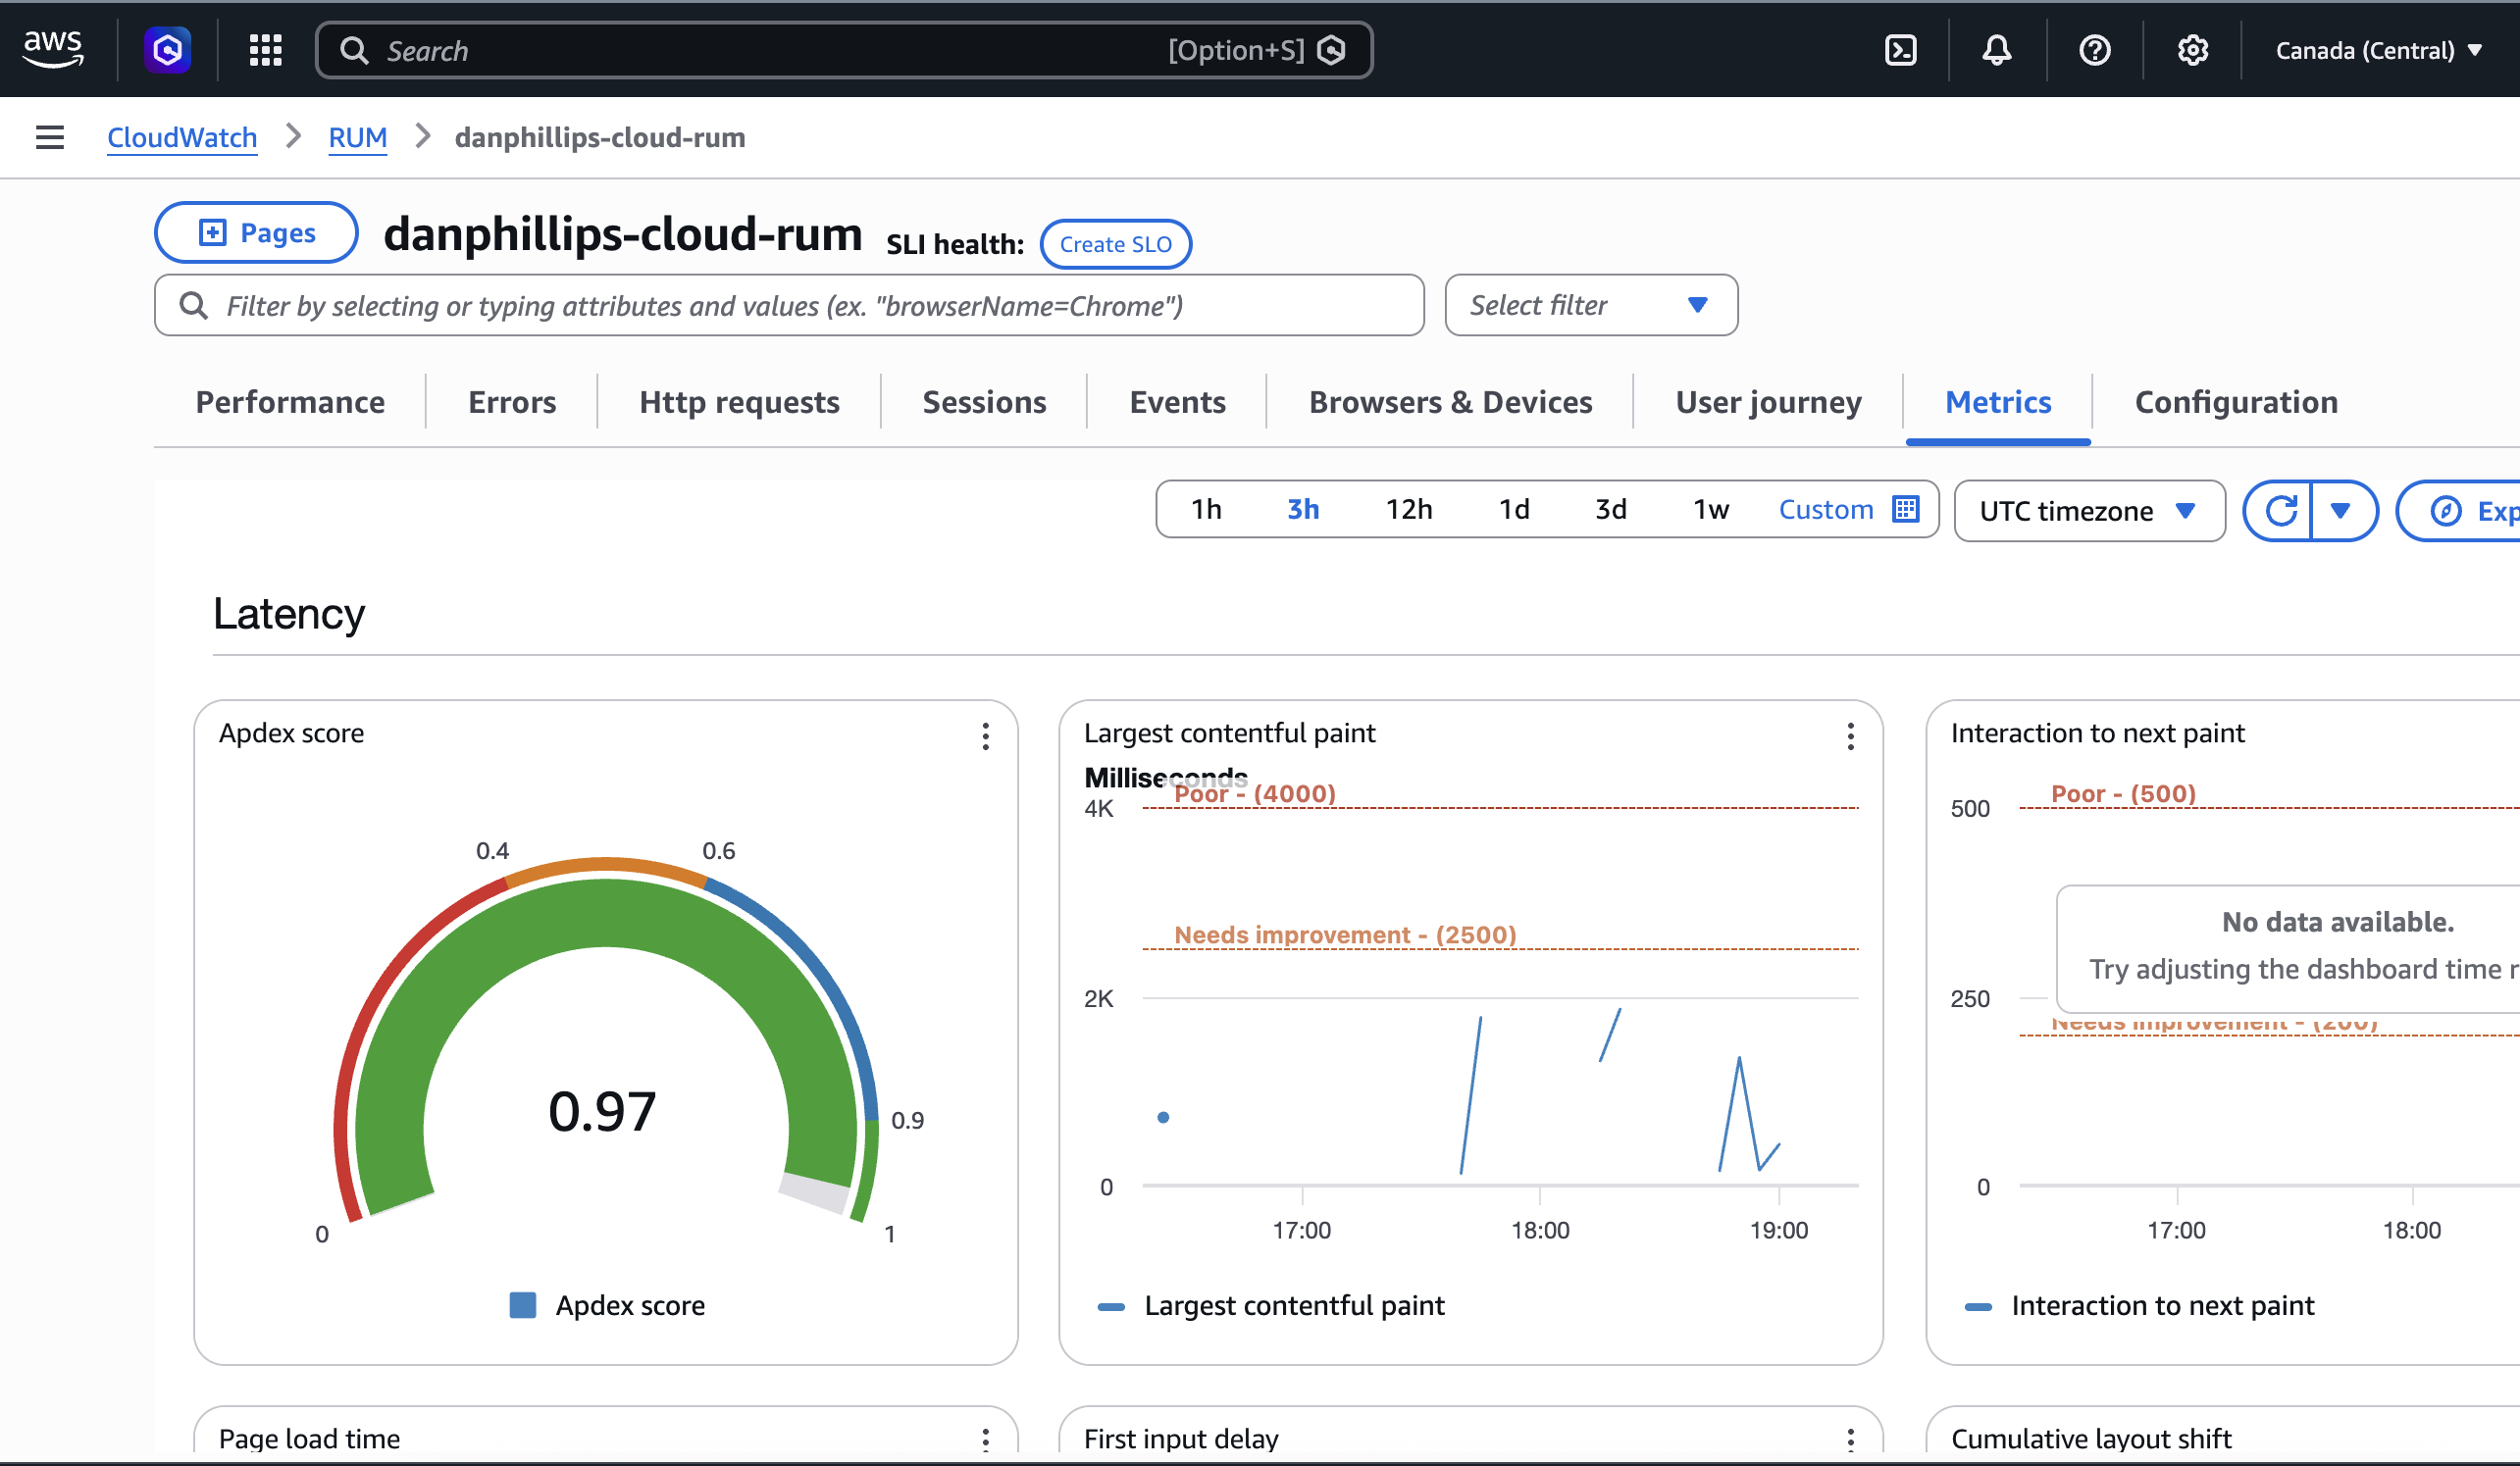
The metrics tab: aggregated Web Vitals, error rates, and HTTP failures at a glance.
What is RUM?
Real User Monitoring (RUM) is a category of observability tooling that captures performance and error data directly from your users' browsers. Not synthetic tests run from a lab. Not server-side metrics. Actual telemetry from actual people loading your actual site.
CloudWatch already covers infrastructure metrics, logs, and distributed tracing via X-Ray. RUM is the missing piece: the client side. You inject a small JavaScript snippet into your pages, and it starts capturing data immediately.
TL;DR
- CloudWatch RUM gives you real browser telemetry: page speed, errors, and failed requests
- Cognito handles credentials securely so no IAM keys end up in your HTML
- Two gotchas worth knowing: the
cwr.jsscript host is us-east-1 only, and domain matching is strict - Setup takes about an hour. Worth it.
The problem with a visitor counter
Hit F5 a hundred times and you have a hundred visitors. Let a bot scrape the page and you have thousands. There's no session deduplication, no filtering of your own dev traffic, no way to know if a real person actually read anything, or if the page even loaded without errors.
It's a vanity metric dressed up as observability.
What I actually want to know:
- Is my site fast for real users on real networks?
- Are there JavaScript errors I don't know about?
- How does the page perform on mobile vs desktop?
A counter answers none of those. CloudWatch RUM answers all of them.
What RUM gives you
CloudWatch RUM captures telemetry from every visitor's browser:
- Web Vitals: how fast the page loads, how quickly it responds to clicks, and how much the layout shifts while loading. Real numbers from real browsers.
- JavaScript errors: unhandled exceptions surfaced immediately, not when a user complains.
- HTTP monitoring: request timing and failures across every fetch and API call on the page.
- Session data: navigation patterns, browser and OS breakdown.
Data is retained for 30 days. Cost at current traffic levels: ~$0/month, well within the 1M events/month free tier.
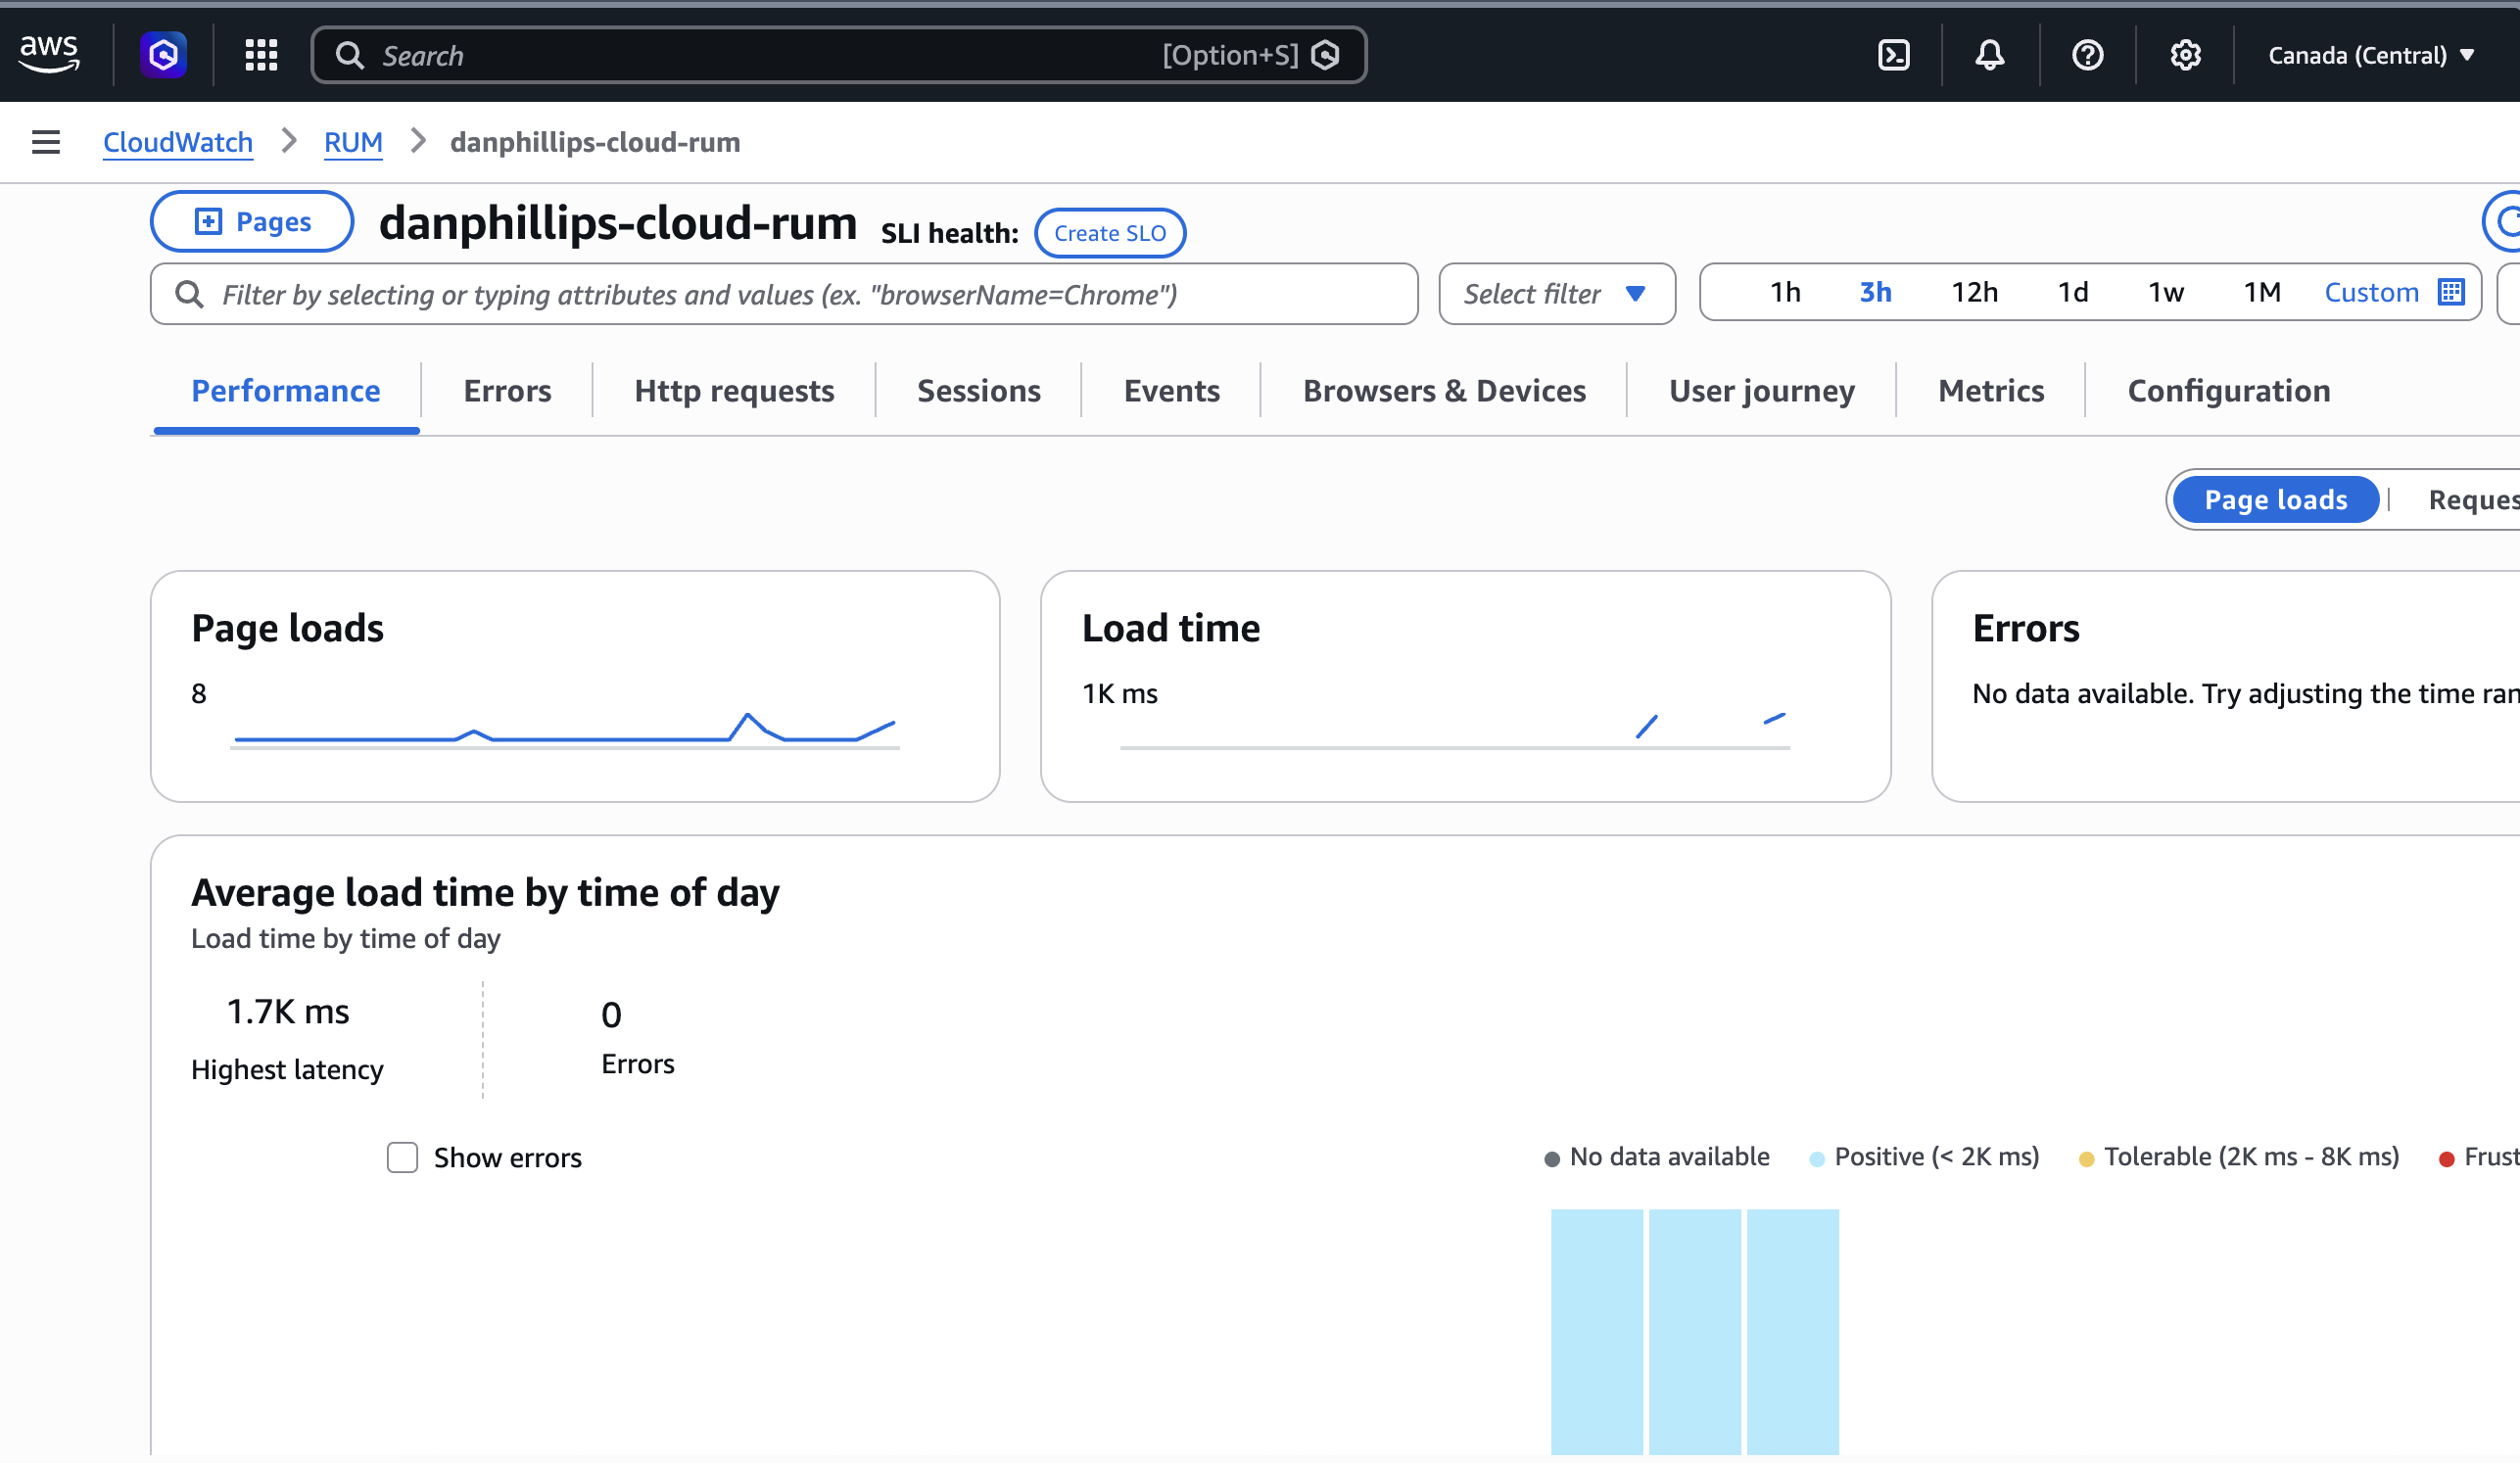
The performance tab: page load timing from real browsers, not a synthetic test.
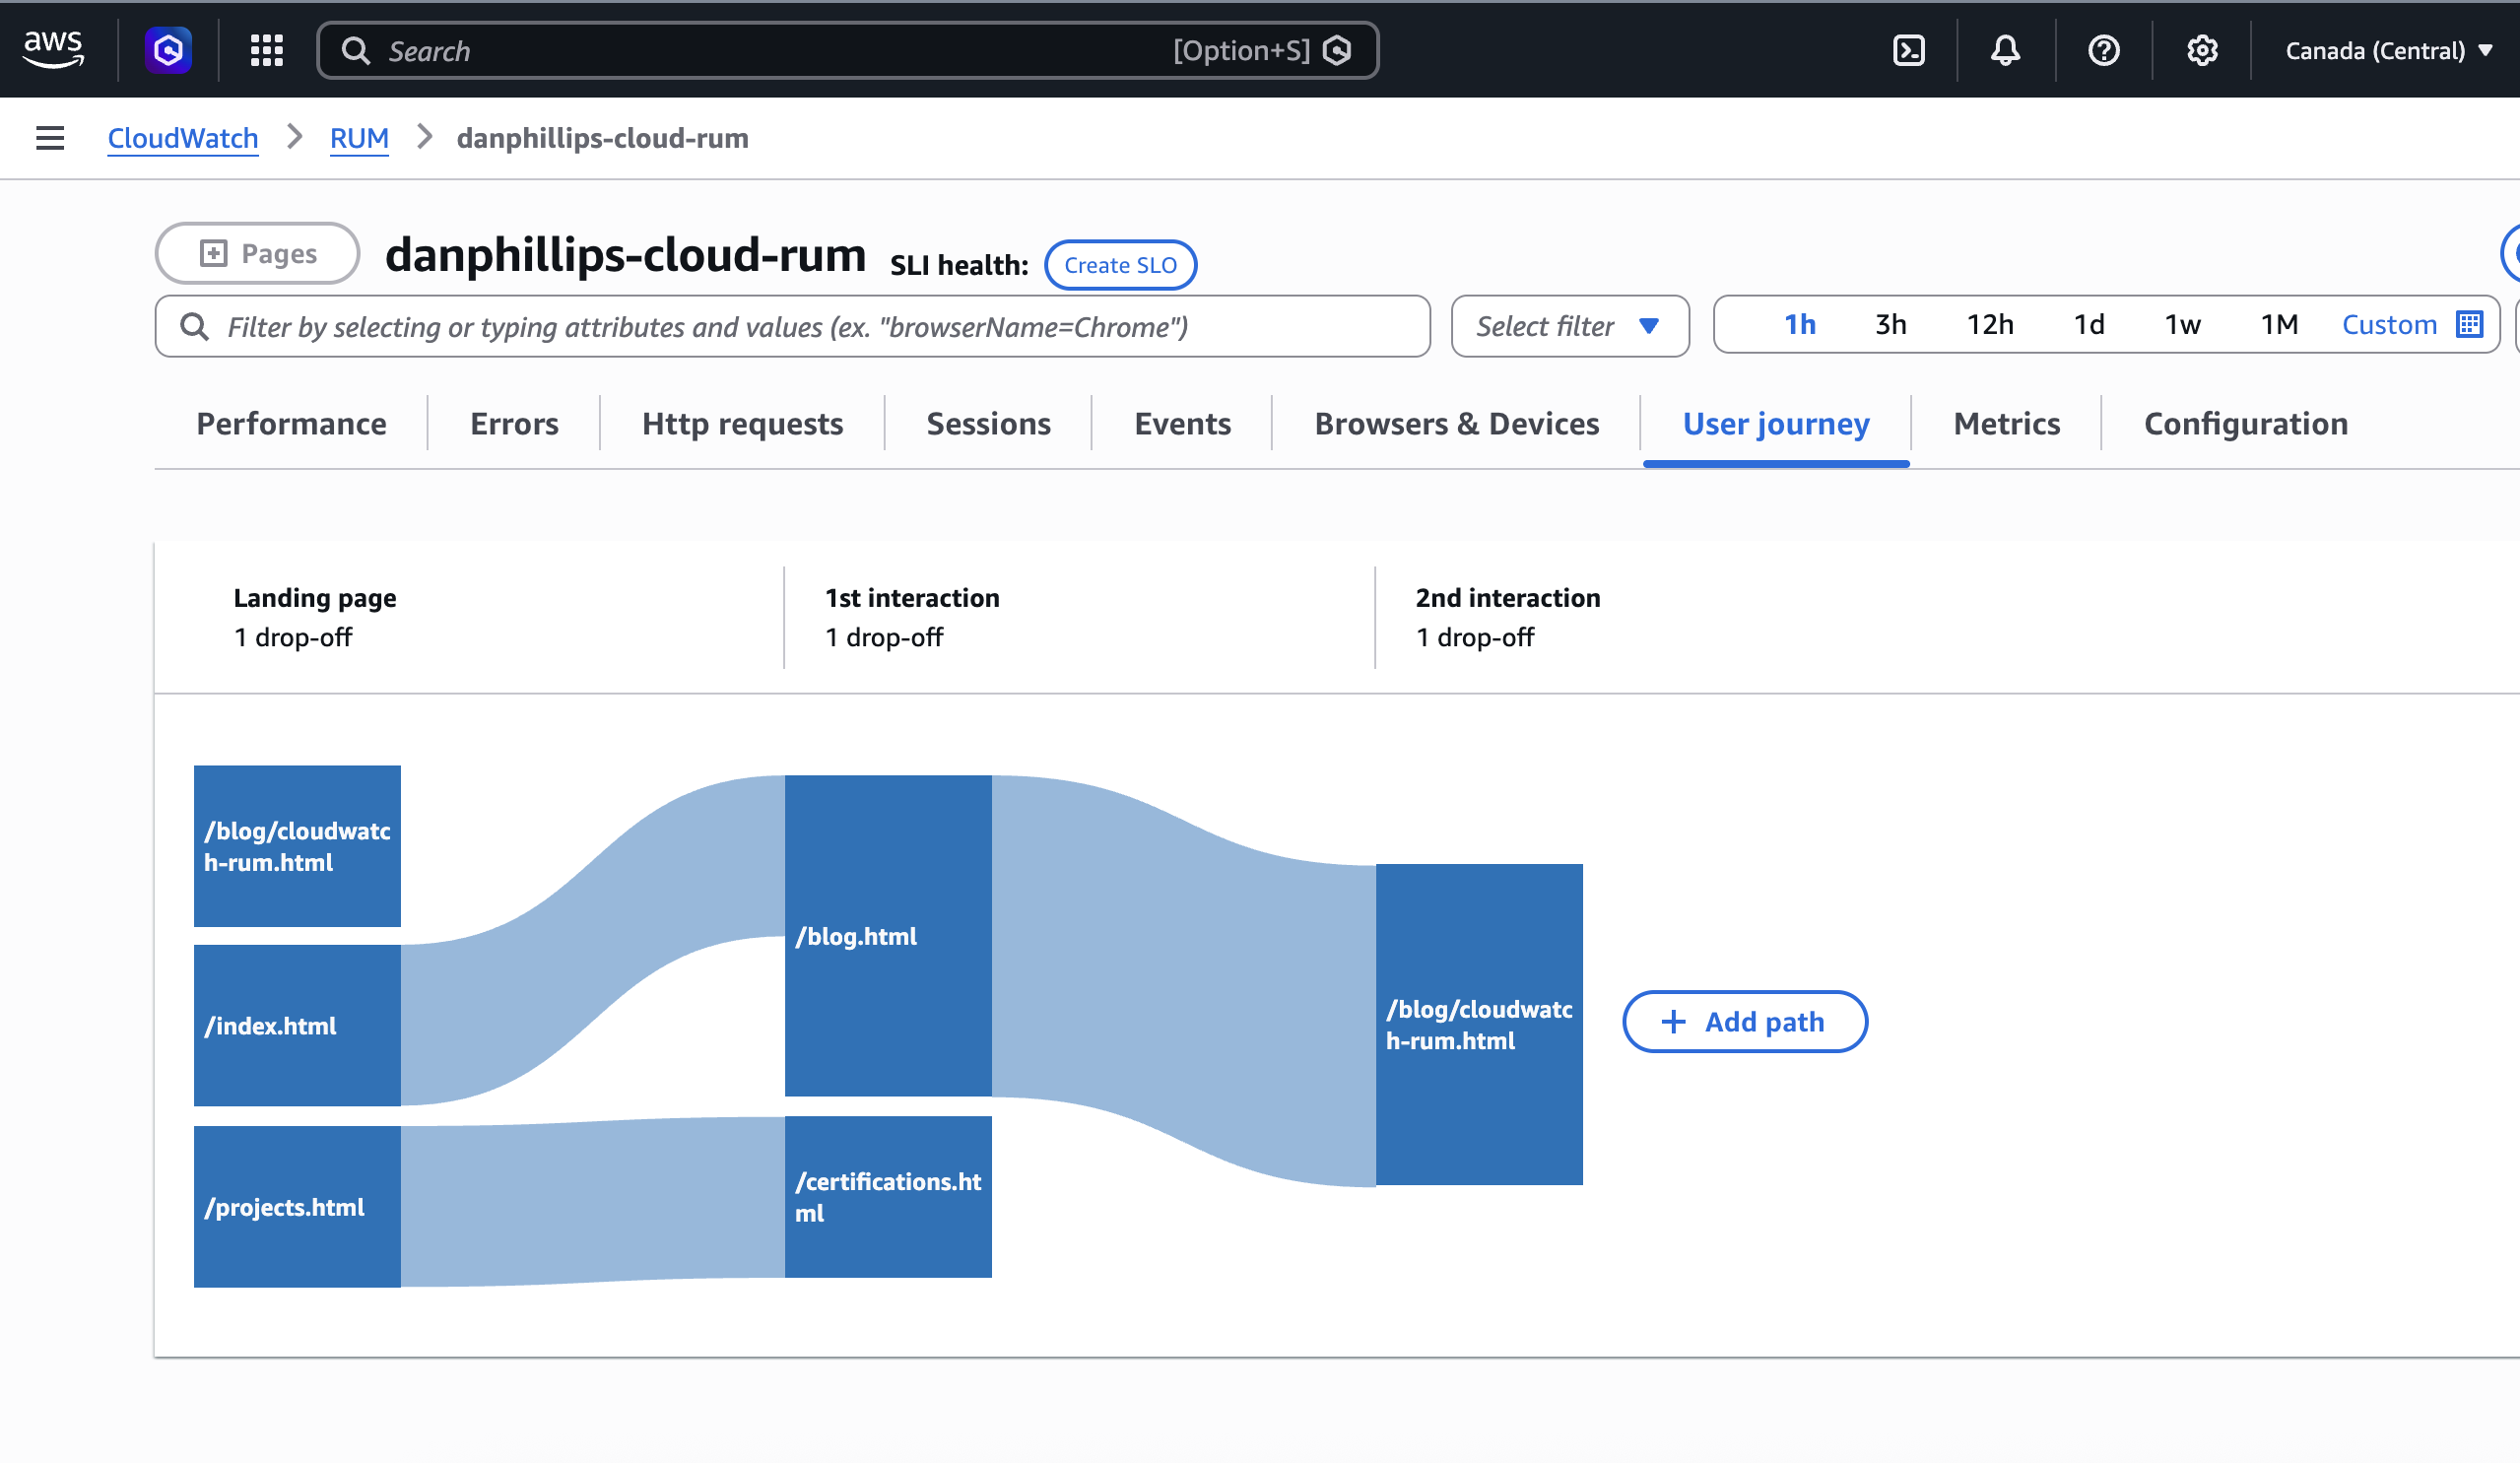
The user journey tab: how people actually move through the site.
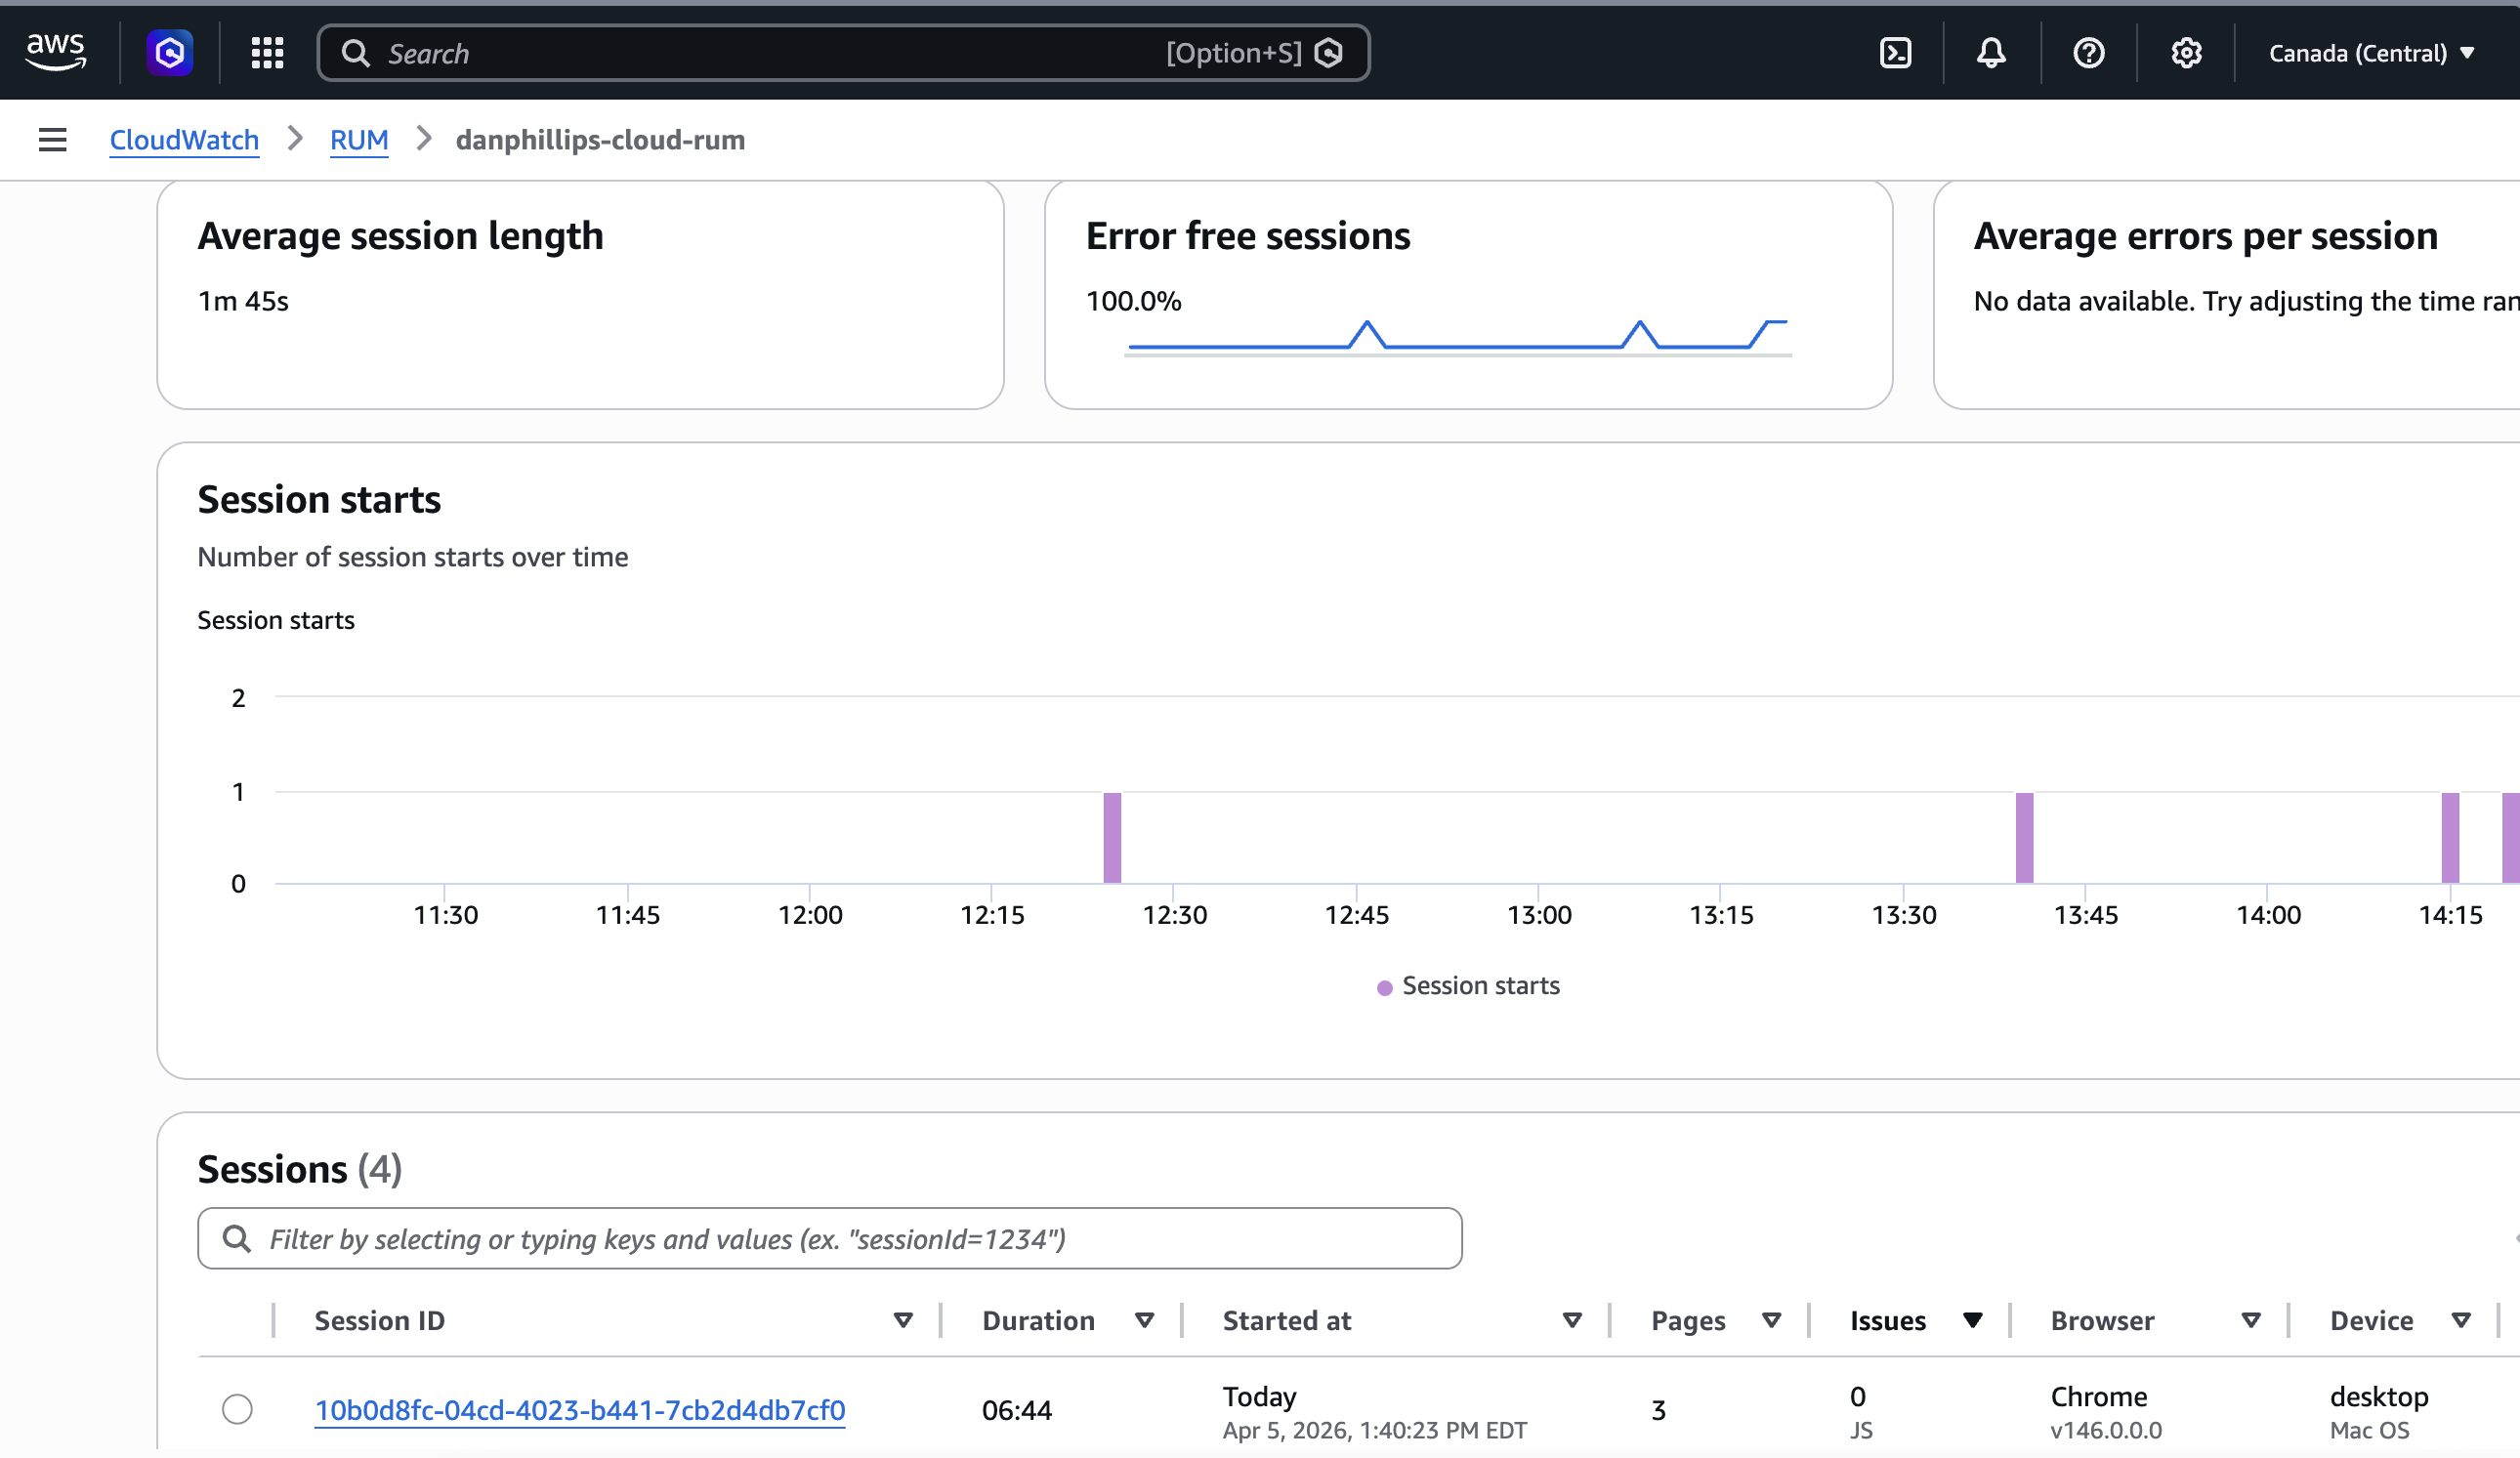
Session counts. The numbers are real. The audience is mostly me.
Architecture
The tricky part is getting AWS credentials into the browser securely. The SDK needs credentials to POST events to the RUM dataplane, but embedding IAM keys in client-side HTML is a security disaster. Anyone can view source.
The solution is an unauthenticated Cognito Identity Pool. This is a standard AWS pattern for vending short-lived, scoped credentials to untrusted clients. Mobile apps use it, IoT devices use it, and it works equally well here. At runtime, the SDK calls Cognito, gets back temporary credentials scoped to rum:PutRumEvents on this app monitor only, and uses those to send events. No login. No secrets in the HTML. Least-privilege IAM by design.
Three resources, all deployed via CloudFormation:
- Cognito Identity Pool: vends temporary credentials to anonymous browser sessions
- IAM Role: scoped to
rum:PutRumEventson this app monitor only - RUM App Monitor: configured for
www.danphillips.cloud, captures errors, performance, and HTTP telemetry
The flow:
graph LR
A[Browser] -->|1. load cwr.js| B[SDK Script Host us-east-1]
A -->|2. get credentials| C[Cognito Identity Pool ca-central-1]
C -->|3. scoped creds| A
A -->|4. POST events| D[RUM Dataplane ca-central-1]
D --> E[CloudWatch RUM App Monitor]
Two things that will catch you out
The AWS docs are straightforward and worth reading before you start. That said, two things tripped me up that the docs don't make obvious.
The cwr.js script host: us-east-1, always — or maybe not
404 on SDK load
The SDK failed to load with a 404 on client.rum.ca-central-1.amazonaws.com. I assumed the script host would follow the same pattern as the dataplane: region-specific. So I tried us-east-1, it worked, and I moved on.
Here is where I have to be honest: the AWS docs show the script URL pattern as client.rum.{region}.amazonaws.com, which implies it is region-specific. But the console-generated snippet for my ca-central-1 App Monitor used us-east-1. And the ca-central-1 URL gave me a 404.
I am not sure whether ca-central-1 just does not have a CDN endpoint for the script, or whether the docs are describing a pattern that does not apply to all regions yet, or whether something else was going on. The docs are not clear on this and I could not find a definitive answer.
What I did: use whatever URL the AWS console generates when you set up the App Monitor. Do not assume a regional pattern. If you are in ca-central-1, that means us-east-1 for the script host and ca-central-1 for the dataplane endpoint — at least for now.
If us-east-1 has a bad day, your RUM snippet stops loading regardless of where your infrastructure runs. For a portfolio site that is an acceptable risk. For production, worth thinking about.
The App Monitor domain must match your canonical URL
HTTP 400 on every event
Everything was loading. Cognito credentials came back fine. But every event POST returned HTTP 400.
I had configured the App Monitor against danphillips.cloud (apex), forgetting that the apex domain redirects to www.danphillips.cloud. The RUM dataplane does a strict hostname match. No wildcards, exact string only. I had the redirect documented right there in the CloudFormation templates and still got it wrong.
Fix: One line in rum.yaml. Configure against the URL the browser actually lands on, after any redirects. And always check the response body in DevTools, not just the status code. The 400 body told me exactly what was wrong in one line.
Before you start
The payoff is immediate. Once it's working you have page speed data, error tracking, and HTTP monitoring on every page load. No dashboards to configure, no agents to install.
Follow the AWS getting started guide and get your snippet from the console. It gives you the correct, current format for your specific setup.
Know your canonical URL before you configure the App Monitor. After redirects. What the browser actually lands on, not what you think it is.
Read the response body. Not just the status code. The RUM dataplane error messages are specific and tell you exactly what to fix.
RUM has an ingestion delay. Events can take up to 15 minutes to appear. Confirm requests are getting 200s in the Network tab before assuming something is broken.
The snippet
Get this from the CloudWatch RUM console for your own app monitor ID and region.
<script>
(function(n,i,v,r,s,c,u,x,z){x=window.AwsRumClient={q:[],n:n,i:i,v:v,r:r,c:c,u:u};
window[n]=function(c,p){x.q.push({c:c,p:p})};
z=document.createElement('script');z.async=true;z.src=s;
document.head.insertBefore(z,document.getElementsByTagName('script')[0]);
})('cwr',
'YOUR_APP_MONITOR_ID',
'1.0.0',
'YOUR_REGION',
'https://client.rum.us-east-1.amazonaws.com/1.20.0/cwr.js',
{
  sessionSampleRate: 1,
  guestRoleArn: "arn:aws:iam::YOUR_ACCOUNT:role/YOUR_UNAUTH_ROLE",
  identityPoolId: "YOUR_REGION:YOUR_IDENTITY_POOL_ID",
  endpoint: "https://dataplane.rum.YOUR_REGION.amazonaws.com",
  telemetries: ["performance","errors","http"],
  allowCookies: true,
  enableXRay: false
});
</script>
The snippet is static, baked into the HTML at deploy time. If you need to update it, regenerate from the CloudWatch RUM console and redeploy.
CloudWatch already gives you metrics, logs, and traces. RUM adds the one signal you can't get from the server side: what it actually felt like to load your site. Worth the extra hour.